
Reviewing Bitcoin's Popular Stock-to-Flow Model
June 1st, 2026
Bottom Line
We set out to answer a simple question: does stock-to-flow tell us something real about Bitcoin, or does it only look powerful because it wraps a good story in precise numbers? What we found is that the scarcity story is compelling and may capture a real long-run relationship, but the model's famous price targets broke down once they met the real market. The practical takeaway is narrow but useful: give stock-to-flow modest weight as a way to think about shrinking new supply, and zero weight as a price target or a reason to size a position.
Thesis
The question behind this edition is not whether Bitcoin is scarce. It is. The question is whether that scarcity can be turned into a reliable price model. Plan B's stock-to-flow work became famous because it did two things at once: it translated the loose idea of "digital gold" into one simple number, and it attached that number to forecasts that looked unusually scientific, with headline fit statistics of 95% and 99.7%. We wanted to separate those two claims. What our research kept pointing back to is a balanced conclusion: stock-to-flow is a strong explanatory story about Bitcoin's hardness, but a weak tool for predicting where price will go on any useful timetable.
Evidence
What is scarcity here, and why did the idea spread so fast?
We should start with the basic concept, because the model's appeal begins there. Stock-to-flow measures hardness: the size of the existing pile divided by the amount of new supply created each year. In plain English, a high ratio means the pile is already so large, and the annual trickle of new supply so small, that producers cannot suddenly flood the market and dilute the asset. That is the intuition behind gold's long monetary history, and it is the same intuition Plan B applied to Bitcoin.
That framing matters because it gives Bitcoin's scarcity a concrete shape. Gold has traditionally been the benchmark hard money because its stock-to-flow sits around the low-to-mid 60s, meaning annual mine supply is tiny relative to the existing hoard. Bitcoin's issuance schedule is fixed in code, and every four years the halving cuts new issuance in half. That means Bitcoin's stock-to-flow roughly doubles each cycle: about 12 after the 2016 halving, about 28 in 2020, about 65 after the 2024 halving, and roughly 127 by May 2026. By this one measure, Bitcoin now screens as about twice as scarce as gold.

This is why the story traveled so far. It took a fuzzy slogan, "Bitcoin is digital gold," and turned it into a single number that could be ranked beside gold and silver. It was easy to explain, easy to share, and easy to remember: limited supply plus falling new issuance should mean a higher value over time. Our reading of the sources suggests that simplicity mattered as much as the math. A reader did not need a finance background to understand the claim.
The timing helped too. The model arrived just before the 2020-21 institutional wave, when large investors were already looking for a cleaner way to talk about Bitcoin as a hard asset rather than a speculative toy. The pseudonymous quant persona behind Plan B, plus the now-iconic rainbow-colored chart, gave the idea a strong social wrapper. And the statistics gave it authority. A model showing a 95% fit in the original version and 99.7% in the later cross-asset version does not just sound interesting; it sounds settled.
The model's claim was bigger than the story
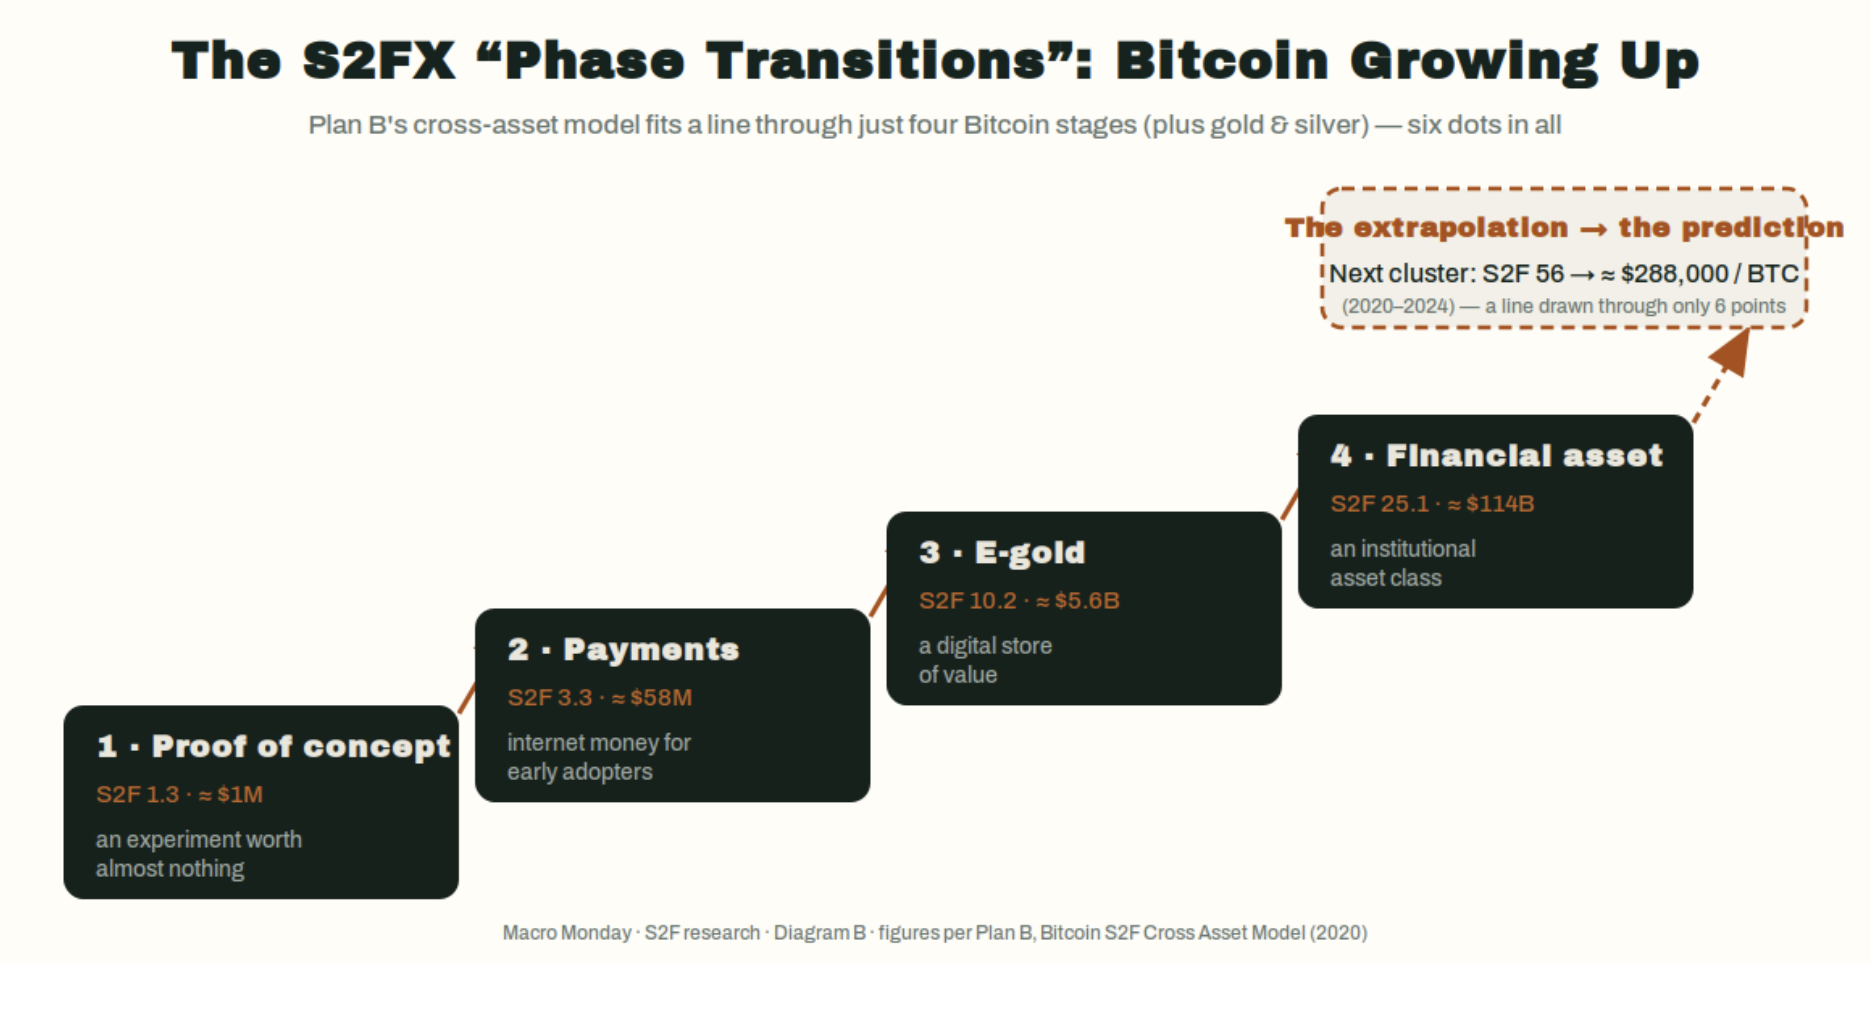
The next question we asked was what the models actually claimed, in plain terms. The original stock-to-flow model, published in March 2019, did not just say that scarcity matters. It said Bitcoin's market value could be explained by scarcity alone. Formally, it fit a regression of log market value on log stock-to-flow with an R-squared of 95%, and it projected that after the 2020 halving Bitcoin would be worth about $1 trillion in market value, or roughly $55,000 per coin.
That was already a bold claim. It implied that one supply-side variable could explain most of Bitcoin's value. But the later cross-asset version, S2FX, made an even bigger leap. Instead of keeping Bitcoin on its own timeline, it lined up four Bitcoin phase clusters next to gold and silver as if they were points on one common ladder. In that version, Bitcoin moved from proof-of-concept to payments to e-gold to financial asset. The regression's reported fit rose to 99.7%, and the model's next target jumped to about $5.5 trillion in market value, or roughly $288,000 per Bitcoin during the 2020-24 cycle.
We can see why readers found this persuasive. The progression has a strong narrative rhythm. Bitcoin does not just get scarcer; it "grows up" into a new monetary role each cycle. The famous chart gave that thesis a single visual center: a line running through Bitcoin's history that made past rallies look like confirmations rather than surprises.

Plan B's response to the obvious market-efficiency objection also deserves fair treatment. Critics argued that if Bitcoin's supply path is public and fixed, the market should already price it in. His answer was not irrational. He argued that the market may systematically overestimate Bitcoin-specific risks, such as miner stress after halvings or broader failure scenarios, so as those feared outcomes fail to appear, the risk premium fades and price rises toward the model. We do not need to accept that as proven to see that it is at least a coherent defense.
That is an important distinction for this piece. The steelman is not "the model hit every number." It did not. The steelman is that the model points to a real supply mechanism, then adds a plausible behavioral explanation for why a public schedule might still matter in price.
Why the near-perfect fit should make readers more careful, not less
The problem is that a compelling mechanism is not the same thing as a reliable model. When we moved from the story to the model construction, the weaknesses became hard to ignore.
The first weakness is statistical. Both Bitcoin's price and Bitcoin's stock-to-flow rise over time. When two series trend upward together for long enough, a simple regression can produce a very high fit even if the underlying connection is weak or meaningless. That is the core spurious-regression critique. In one sharp summary from the critique literature, the regression may be doing little more than estimating Bitcoin's historical growth trend.
The second weakness is that when researchers try to strip out that shared time trend, the magic largely disappears. In the critique cited in our research, the stock-to-flow coefficient is no longer statistically significant once time fixed effects are included, with a reported p-value around 0.39. A separate critique found that plain circulating supply tracks market capitalization about as well as stock-to-flow does, and that after correcting for autocorrelated residuals, the stock-to-flow term is effectively zero. In plain language: once the time trend is handled more carefully, the model stops looking uniquely informative.
The third weakness is conceptual rather than statistical. The model looks only at supply. Price does not. Price is always the meeting point of supply and demand. A pure scarcity metric can tell us that new supply is shrinking, but it cannot tell us whether demand will surge, stall, or collapse. That omission matters because the largest real price moves are often demand-driven.
The fourth weakness is the gold comparison itself. Gold is the benchmark hard asset precisely because its stock-to-flow has been stable and high for a very long time. Yet gold's market value did not stay remotely stable alongside that ratio. Over roughly the past century, its stock-to-flow sat near 60 while its value ranged from about $60 billion to about $9 trillion, roughly a 150-fold swing. That does not mean scarcity is irrelevant. It means scarcity alone is not a law of value.
The fifth weakness sits inside the cross-asset model. Its famous 99.7% fit came from six points: four hand-grouped Bitcoin clusters plus gold and silver. That is too small and too curated a sample to carry the weight many readers put on it. The result may be interesting as a framing device, but it does not amount to proof.
The cross-asset visual helps explain both the attraction and the problem. It is elegant. It is memorable. But it also asks the reader to accept that these selected clusters and metals belong on one regression line, which is a much larger assumption than the chart's neatness suggests.
This is where the balanced reading becomes important. We should not confuse "there is a plausible supply mechanism" with "the model's coefficients and targets are trustworthy." The first claim may survive. The second is much harder to defend.
The real track record was strong until it wasn't
The hardest test for any model is not whether it tells a compelling story, but whether its forecasts hold up after readers start relying on them. Here the picture changes meaningfully.
For a while, stock-to-flow genuinely looked vindicated. From roughly 2015 through late 2021, Bitcoin's price tracked the model line closely enough that each rally looked like fresh proof. The 2020 halving was followed by a run to Bitcoin's roughly $69,000 peak in November 2021, which seemed close enough to the original post-halving ~$55,000 call to reinforce confidence rather than weaken it.
The trouble came when the targets got more explicit. Plan B's separate short-term floor model called for $98,000 by November 2021 and $135,000 by December 2021. Bitcoin instead closed those months near $49,484 and $47,299. Those are not narrow misses. They are misses by about half.
That miss mattered for two reasons. First, it broke the aura of precision. Second, it forced a distinction between the failed floor model and the supposedly still-intact long-term stock-to-flow model. Plan B explicitly conceded "Nov98K & Dec135K miss = FLOOR MODEL FAIL ... S2F MODEL INTACT." Critics reasonably read that as moving the goalposts, especially because earlier messaging had implied that a sub-$100,000 December 2021 price would invalidate the stock-to-flow thesis.
Then came the 2022 collapse. Bitcoin fell to about $16,612 in December 2022, a drawdown that is much easier to explain through demand destruction than through a supply schedule that had not changed. This is exactly the scenario the critics had in mind. A model that only tracks shrinking issuance has no way to see a demand-driven bear market coming.
The later outcome did not repair the forecast record. Bitcoin did eventually trade above $98,000, but not until 2025, years late, and it never reached the cross-asset model's $288,000 target for the 2020-24 cycle. The eventual peak cited in our research was about $123,521 in September 2025. That is materially above the floor targets, but still far short of the cross-asset projection and too late to count as a clean success.

This is the paragraph where the tension has to be named plainly. On one side, the early fit and post-halving rally gave stock-to-flow a real appearance of confirmation. On the other, the dated targets failed, the 2022 collapse exposed the missing demand side, and the cross-asset target never arrived. Those signals do not share a clean "the model works" story. If we have to lean one way, our research leans toward the track record being too weak to justify treating stock-to-flow as a forecasting tool.
The steelman is real, but it leads to humility, not vindication
Still, the case against stock-to-flow is not complete without the strongest defense. Our research found one argument critics cannot dismiss lightly: cointegration.
In simple terms, cointegration asks whether two series that wander over time still maintain a stable long-run relationship. That is different from saying they merely trend up together. The steelman is that Bitcoin market value and stock-to-flow may be genuinely linked in this long-run sense. Nick from BTConometrics argued that the relationship appears cointegrated and could not be falsified. More strikingly, Marcel Burger, who initially criticized stock-to-flow as spurious, later ran three cointegration tests expecting to reject the link and could not. He publicly apologized for dismissing it too quickly.
That matters. An adversarial replication failing to debunk the relationship is not nothing. It raises the possibility that there is a real long-run association here, not just a visual coincidence on a chart.
The mechanism also remains believable. Halvings are real. They mechanically cut new issuance in half. Holding demand constant, that is a genuine supply shock. And Plan B's efficient-market rebuttal remains logically coherent: a public model can still appear to "work" if the market persistently overprices Bitcoin's risks and gradually unwinds that premium as feared breakdowns fail to occur.
But this is where the piece has to stop short of over-correcting. Cointegration is not proof of causation. The data history is still short, on the order of a decade or a bit more, with only a few halvings to learn from. And even if the long-run relationship is real, it says little about short-term price and did nothing to save the failed floor model. So the strongest defense of stock-to-flow still ends in humility. It may point to a real long-horizon scarcity link, but it does not rescue the model as a timing or target-setting tool.
That is the balanced answer the owner asked for. Readers should give equal weight to two truths at once. The scarcity mechanism is not nonsense, and the long-run relationship may be more than a mirage. At the same time, the model's precision is overstated, its construction has real weaknesses, and its public targets have already failed in ways that matter.
Implications
What the findings suggest is a cleaner way to use stock-to-flow. Use it as a language tool, not as a valuation tool. It helps explain one true thing about Bitcoin: new supply keeps shrinking on a known schedule, and that is part of why Bitcoin can plausibly carry a hard-money premium. But that is a very different claim from saying the next halving points to a specific price. For readers, the practical line is straightforward: stock-to-flow can help separate a scarcity narrative from a price forecast. Give it modest weight when thinking about Bitcoin's monetary character, and no weight when deciding on targets, timing, or position size.
What to Watch
Whether future stock-to-flow commentary stays in the narrow lane of scarcity and market structure, or starts turning back into dated six-figure target claims.
Whether the next cycle produces evidence of a stable long-run link again, while remembering that even a long-run link would still not validate short-term price forecasts.
Whether demand-side shocks, such as another sharp risk-off phase, once again dominate the price path despite Bitcoin's mechanically shrinking new supply.
Whether readers and analysts keep the key distinction clear: scarcity may help explain why Bitcoin can carry a premium, but scarcity alone has not proved able to forecast where that premium will trade.
Look out for next week’s newsletter for further insight into the forces shaping today’s markets.